|
|
|
H-1B Prevailing Wage Claims vs. Reality: |
|||||||
|
By Robert Hill, CUNY, Murphy Institute for Worker Education |
|||||||
|
Discussion |
|||||||
|
There are clearly far more computer technology employer requests for H-1B workers via the LCA process than can ever possibly be realized under current law. Congressional caps on the number of H-1Bs available across all SOC codes have remained at the level of 65,000 per year since fiscal year 2004. Yet, computer technology employers alone filed 89,585 LCAs in fiscal year 2010 requesting 232,487 potential workers. Those 89,585 LCAs for computer technology workers represented only about 27% of the total number of 335,328 LCAs filed across all SOC codes for 2010. This study did not count the total number of workers requested across all LCAs, and so it is not possible to calculate the percentage of total requested workers that will ever possibly be hired, but it is less than 1 in 5 if one assumes a ratio of 1 requested worker per LCA (65,000 H-1Bs divided by 335,328 LCAs equals a probability of about 19%). Four of the 10 computer technology SOC codes represented 92% of all LCAs for the entire computer technology sector.
Of these four main SOC code groups, two of them heavily skew the number of requested workers. The 89,318 and 84,362 worker requests (totaling 173,680) for codes 15-1021 and 15-1051, respectively, represent 74.7% of all workers requested. If any effect from weighting was to be seen, it would have been apparent in the results from these two SOC codes. These two SOC codes are thus examined for the net-effect of weighting the LCAs, and the results are shown in Table 7 below.
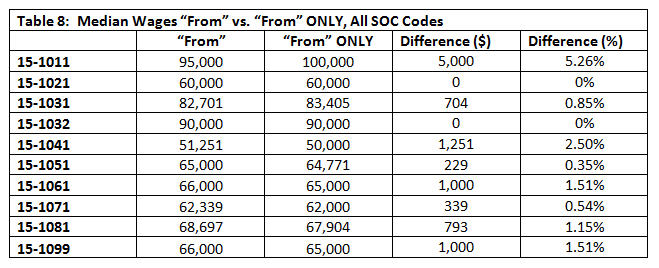
Examination of the median wages for the two SOC codes determines that weighting the data had no significant effect. For 15-1021, the weighted difference was only $1,261 or about 2.10%. For 15-1051, the weighted difference was only $707 or about 1.08%. Since these two SOC codes had the most extreme potential for weighting being significant, and since analysis shows that it is not in their case, then it is reasonable to conclude that the difference between the weighted condition and the non-weighted condition is negligible. It was also thought possible that there would be a significant difference between the median wage calculations along the “From” versus “From” ONLY dimension. Table 8 below examines the differences between the median wages for all 10 SOC codes in the “From” and “From” ONLY non-weighted conditions.
Examination of the DIFFERENCES between the median wages for each SOC code shows that any difference was negligible. The largest difference was for code 15-1011 at 5.26%. But, that difference was represented in only 675 LCAs out of 89,585 total LCAs, or a mere 0.75% of the sample of all LCAs. Similarly, the next largest difference was seen for code 15-1041, but again that was for a mere 533 LCAs, or a mere 0.59% of the LCAs. Because it is clear that neither the weighting nor the “From” ONLY conditions showed a significant deviation from the primary data condition of “From,” non-weighted, as represented in Figure 12 above, the remainder of the discussion will focus solely on the results from that data condition. Indeed, when one compares the results shown in Figures 12 through 15, one can see the following common patterns that they all four share:
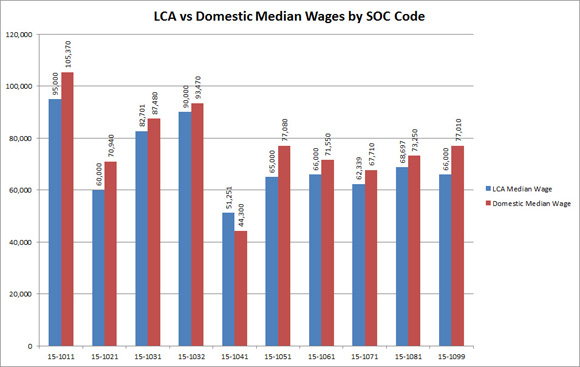
Because the data points for code 15-1041 are clustered very tightly in Figure 12, the same data was recast in a different form in Figure 18 in an effort to examine it more closely. For ease of reference, Figure 18 is re-copied below.
Figure 18 (copy): LCA vs. Domestic Median Wages, by SOC Code
Figure 18 reveals that LCA Median Wages are indeed less than the Domestic OES Prevailing Wages with that one exception. For 15-1041, the LCA Median Wage was $51,251 while the Domestic OES Median Wage was $44,300. This yields a significant difference between LCA and OES wages, as detailed in Table 9 below.
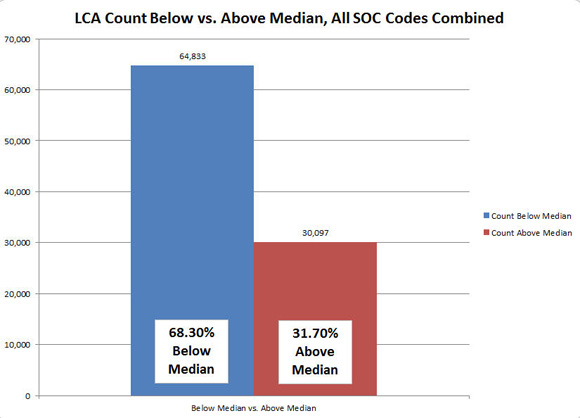
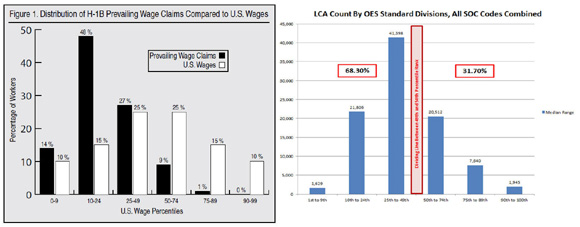
The LCA Median Wage earned by these H-1B workers is a surprising 15.69% higher than those reported for Domestic OES Wages for the same SOC code. However, it must be remembered that SOC code 15-1041 only had 533 LCAs out of all 89,585 computer technology LCAs, representing a mere 0.59% of the total sample. Therefore, this one single example where the LCA Median Wage was higher than the OES Median Wage is valid, but insignificant. The OES Wage Division Points listed in Table 5 were used to derive the Standard OES Percentile Divisions listed in Table 6, for all 10 studied SOC codes. It must be understood that the division points for each SOC code were unique, and that there is a direct relationship to the values for each SOC code in Table 5 to Table 6. The critical distinction to be made, however, is that Table 5 represents OES Wages, while Table 6 represents counts of H-1B workers whose wages fall into the Standard OES Percentile Divisions. These counts were then represented as six bars on Figure 16. The vertical divider in Figure 16 should not be mistaken for additional data, but rather as a dividing line between below-the-median and above-the-median. The analysis is further carried through to Figure 17, copied below, where each side of the below- and above-the-median is aggregated into a binary graph. Figure 17 is re-drawn here for ease of discussion.
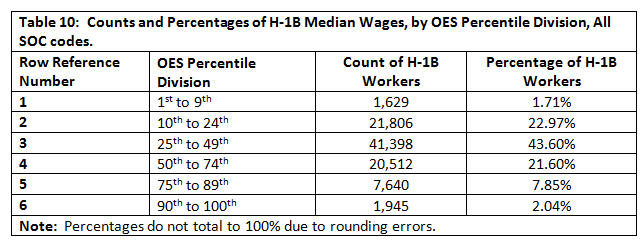
Figure 17 (copy): LCA Count, Below vs. Above Median, All 10 SOC Codes In any so-called normal Bell curve distribution, one expects to see an even distribution on either side of the median. If we were to imagine a theoretically perfect distribution of H-1B workers below-the-median and above-the-median, it would show an exactly equal number on either side, by definition. The above distribution in Figure 17, however, is anything but “normal.” In this distribution, it can be seen that 68.30% of H-1B workers, drawn from fiscal year 2010 data, are working for wages that are below the OES Median Wages for their SOC codes. While the same data shows that 31.70% of H-1B workers are working at-or-above the OES Median Wages for their SOC codes, there is still a more than 2:1 ratio of below-the-median versus above-the-median OES Wage earners. Table 10 below further details the breakdown of these OES Standard Division counts, with data drawn from Figure 16.
The data shown in both Figure 16 and Table 10 do show a roughly normal distribution, but one that is shifted significantly to the left of the median/mean. If Table 10 showed a normal distribution, it would show that Rows 3 and 4 (the 25th – 49th and 50th – 74th divisions), which both represent 25-point spreads, would have roughly the same counts. Instead, that relationship exists between Rows 2 and 4. Further, Row 2 represents a 15-point spread (10th to 24th), so that smaller spread of Row 2 has the same count as the larger spread of Row 4. Rows 1 and 6 do show an approximately normal distribution, being very close in value to each other. Figure 20, below, shows a side-by-side comparison of results of Miano (2007) and the current study, Hill (2011).
Figure 20: Side By Side Comparison of Fig. 5 (Miano, 2007) and Figure 16 (Hill, 2011) Results In this side-by-side comparison view, the following conclusions are self-evident:
|
|||||||
| [Introduction] [History] [LCA / H-1B Process] [For And Against] [Previous Research] [The iCert System] [Methodology (text)] [Methodology (videos)] [Results] [Discussion] [Conclusions] [Downloadable Files] [External Links] |

